CoBank data reveals farmers were aggressive sellers of soybeans in fall 2025
Tanner Ehmke
Key points
- CoBank data shows farmers sold soybeans aggressively last fall while delaying the pricing of corn and wheat.
- Commercial ownership of soybeans rose sharply, and use of delayed pricing and basis contracts for soybeans fell as prices improved after the U.S.–China trade truce.
- Corn and wheat saw the opposite trend: Farmers increased use of DP and basis contracts for corn and wheat, leaving pricing open in hopes of future market recoveries.
- Off-farm grain storage hit record levels last fall as farmers shifted more soybeans and wheat into off-farm commercial storage to free up on farm space for the record corn harvest.
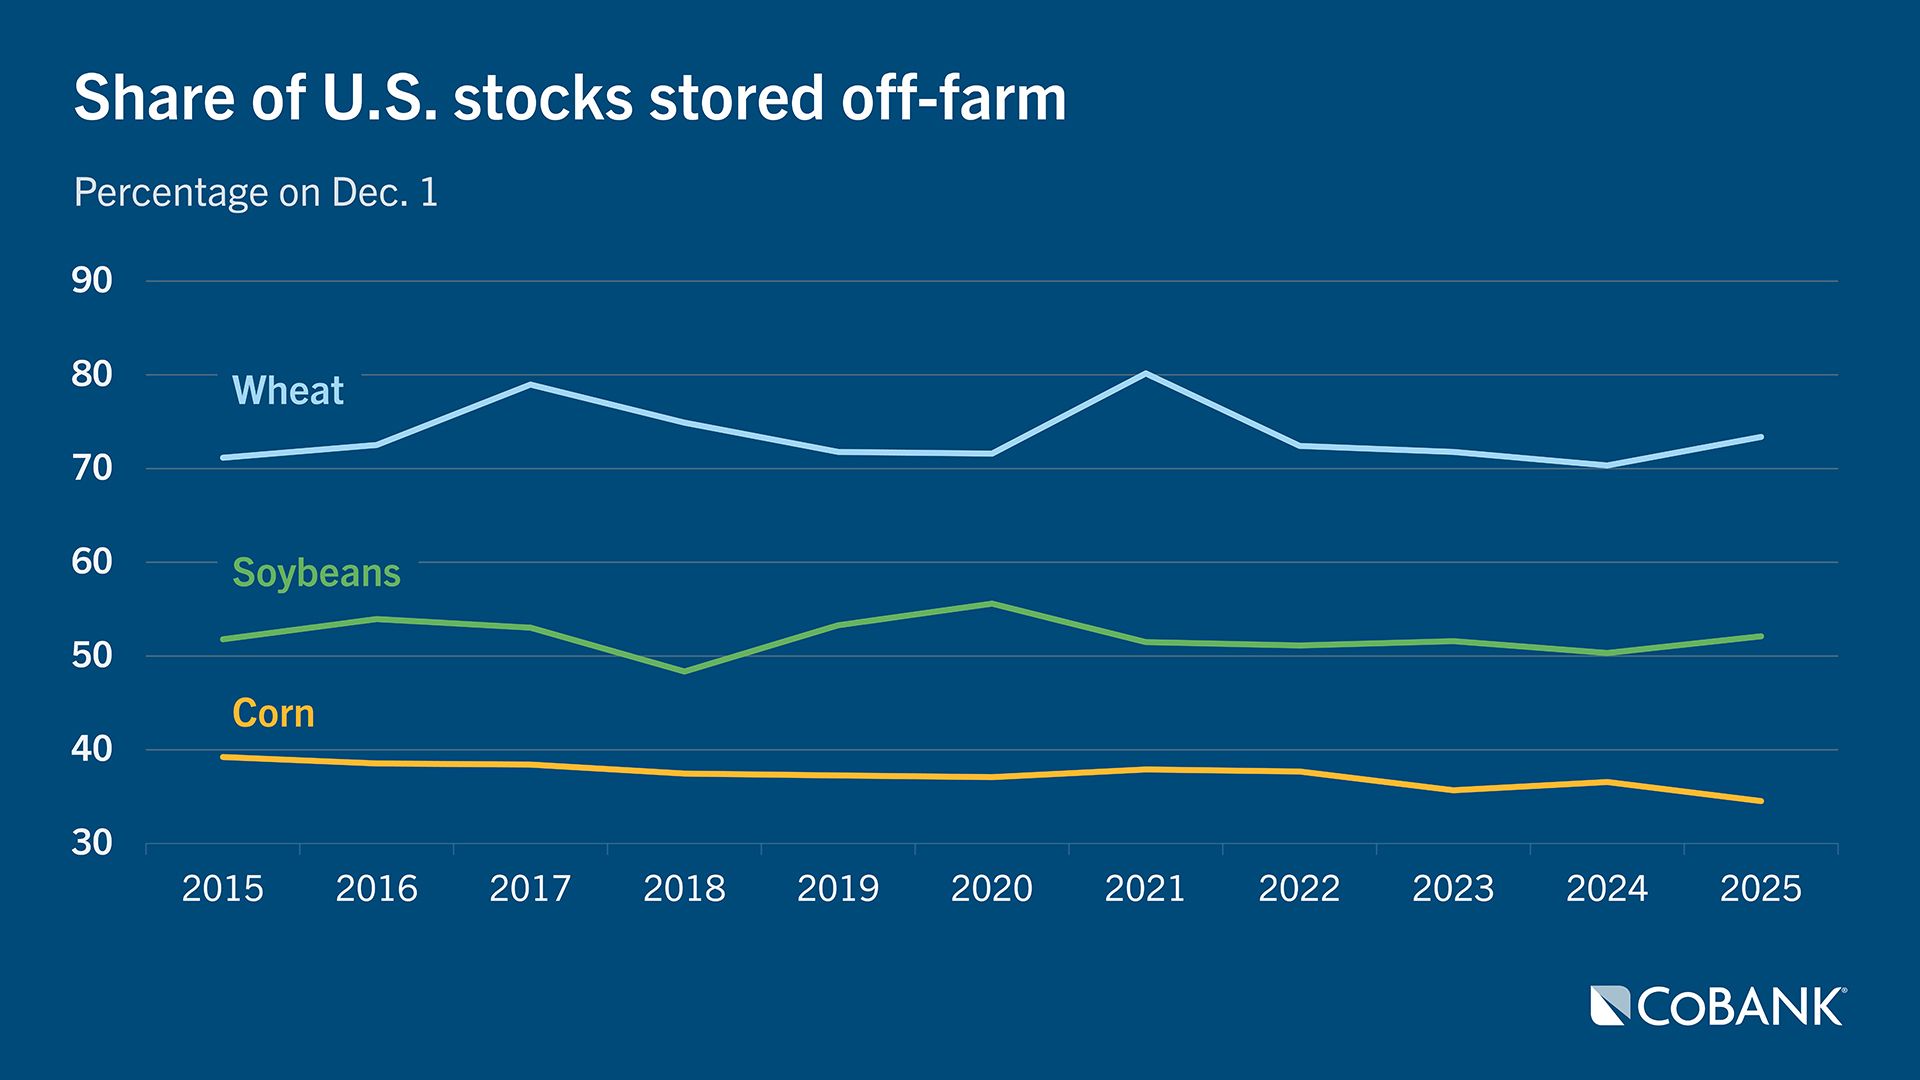
- USDA data showed record-high Dec. 1 stocks for corn, soybeans and wheat. Soybeans and wheat saw notable increases in the share of off farm storage, but corn’s off farm share declined.
Farmers were aggressive sellers of soybeans last fall but were more reluctant to market corn and wheat, according to CoBank’s collateral monitoring reports of grain company customers as of Nov. 30, 2025.
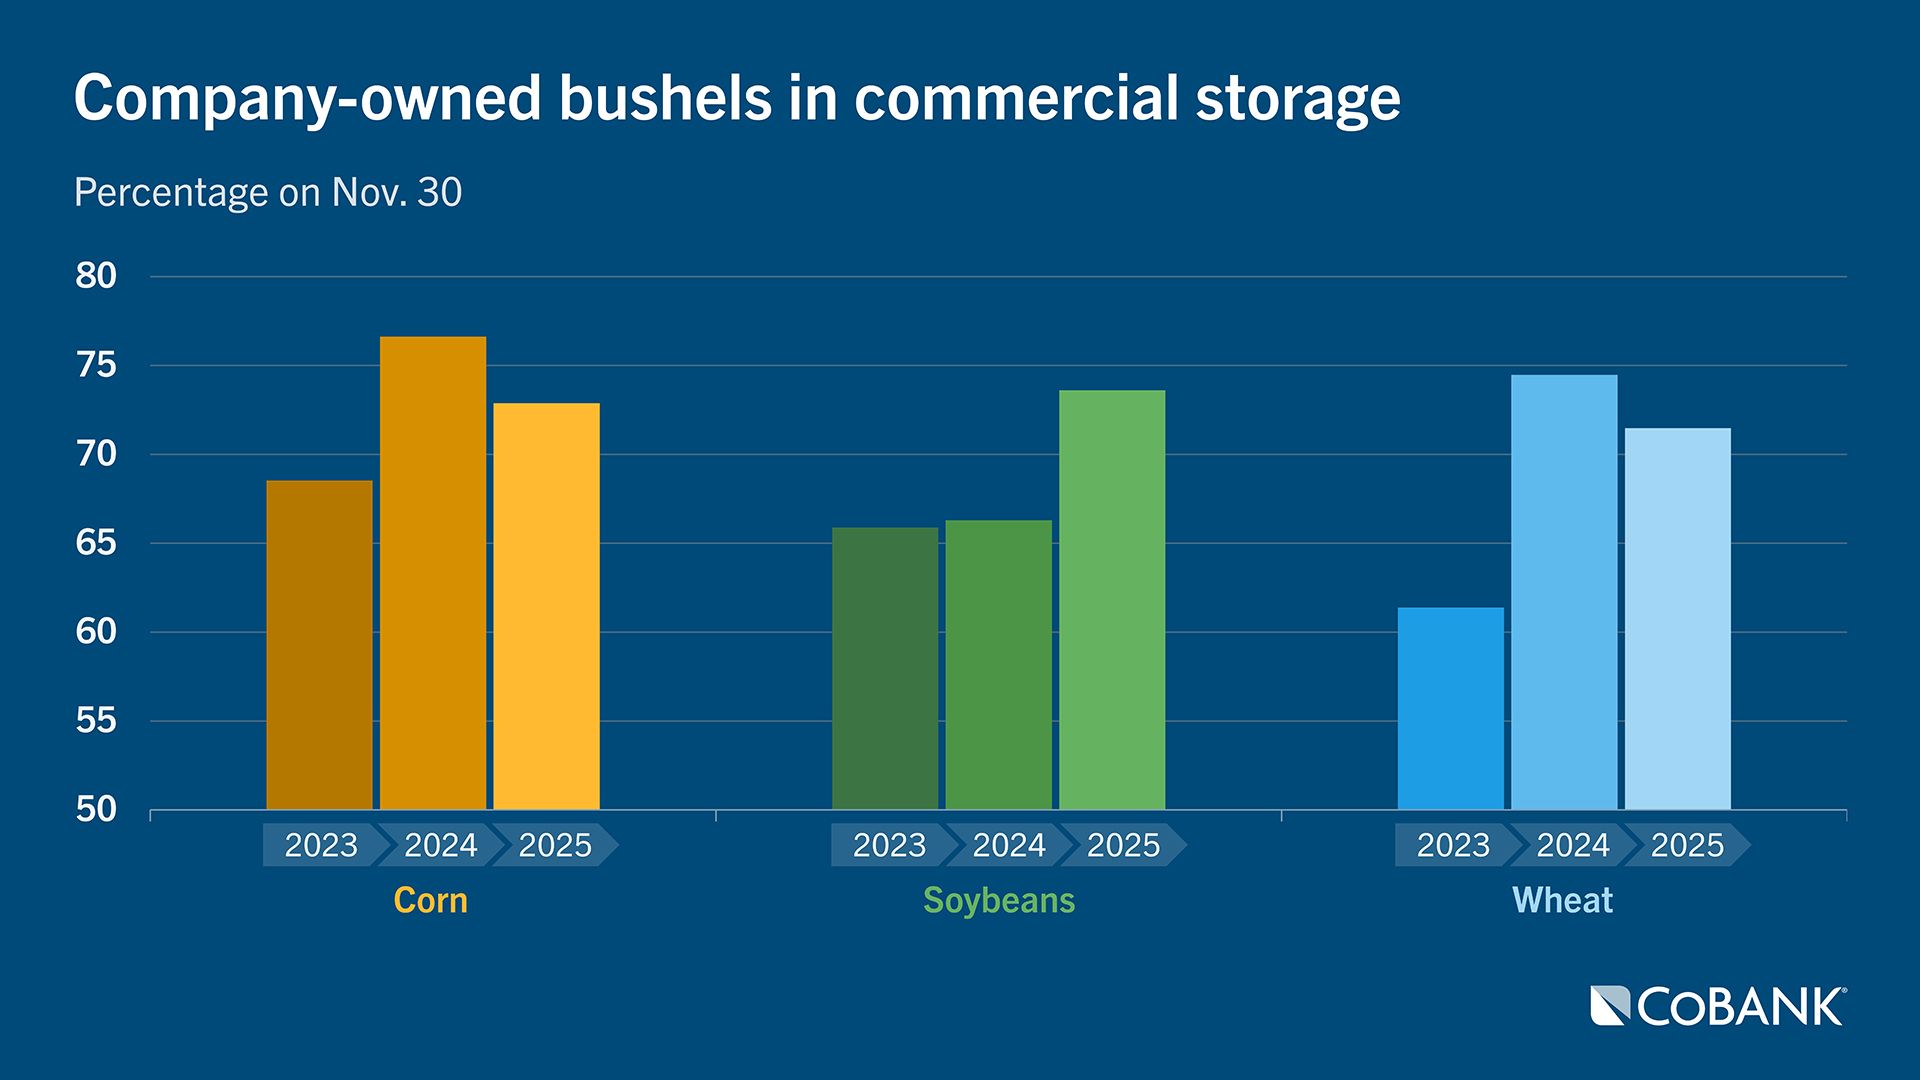
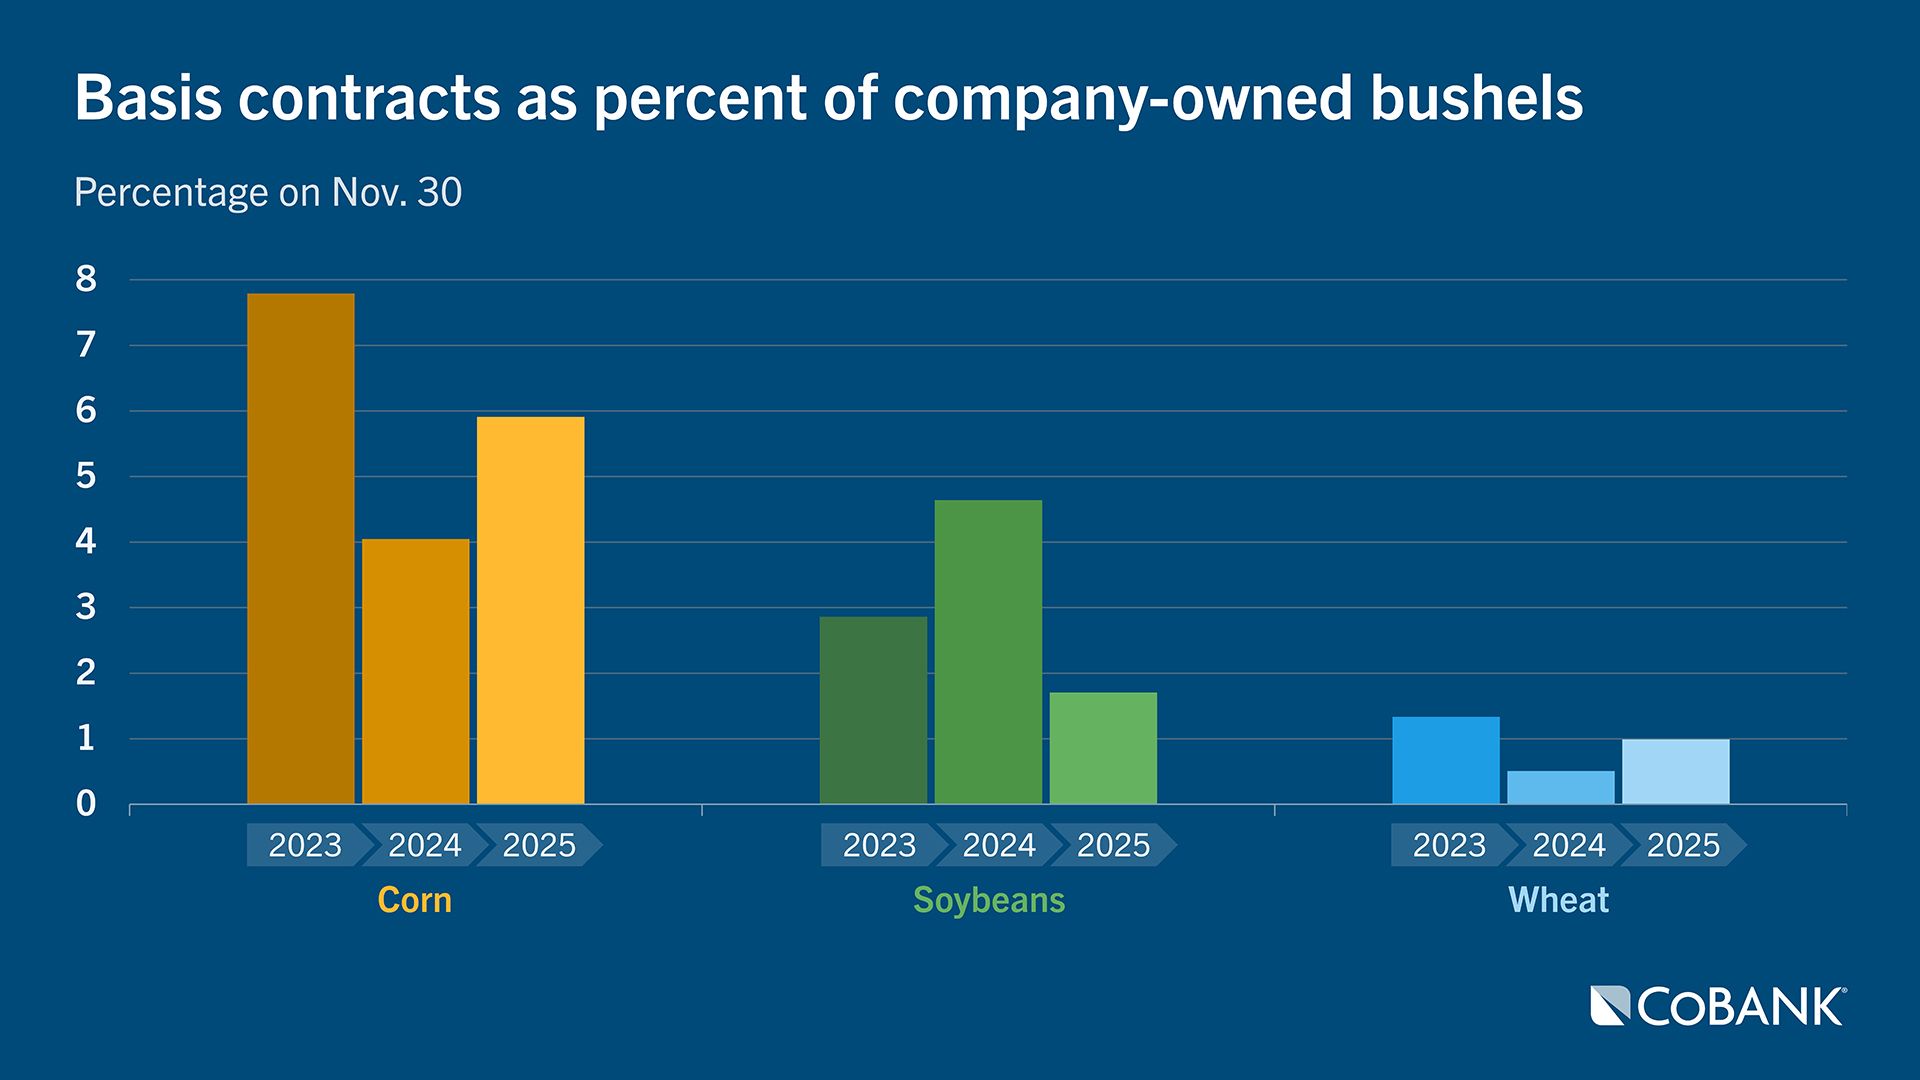
Company ownership of soybeans in commercial storage jumped to 73.6% as of Nov. 30, up from 66.3% the year prior as farmers sold soybeans at a faster pace. The share of soybean bushels in commercial storage that were enrolled in delayed pricing programs and basis contracts also fell last fall as farmers priced soybeans during the market rally following the trade truce between President Donald Trump and Chinese President Xi Jinping.
DP participation in soybeans also fell partially as a result of farmers’ concerns of market uncertainty ahead of the trade truce on Oct. 30, and with elevators also limiting DP programs due to the risk of owning unpriced bushels in a carry market. In a DP program, the farmer transfers title to the elevator with the option for the farmer to set futures and basis at a later date while paying the elevator a monthly service fee. In a basis contract, the farmer locks in local basis when the contract is signed but leaves the futures price open to be set later.
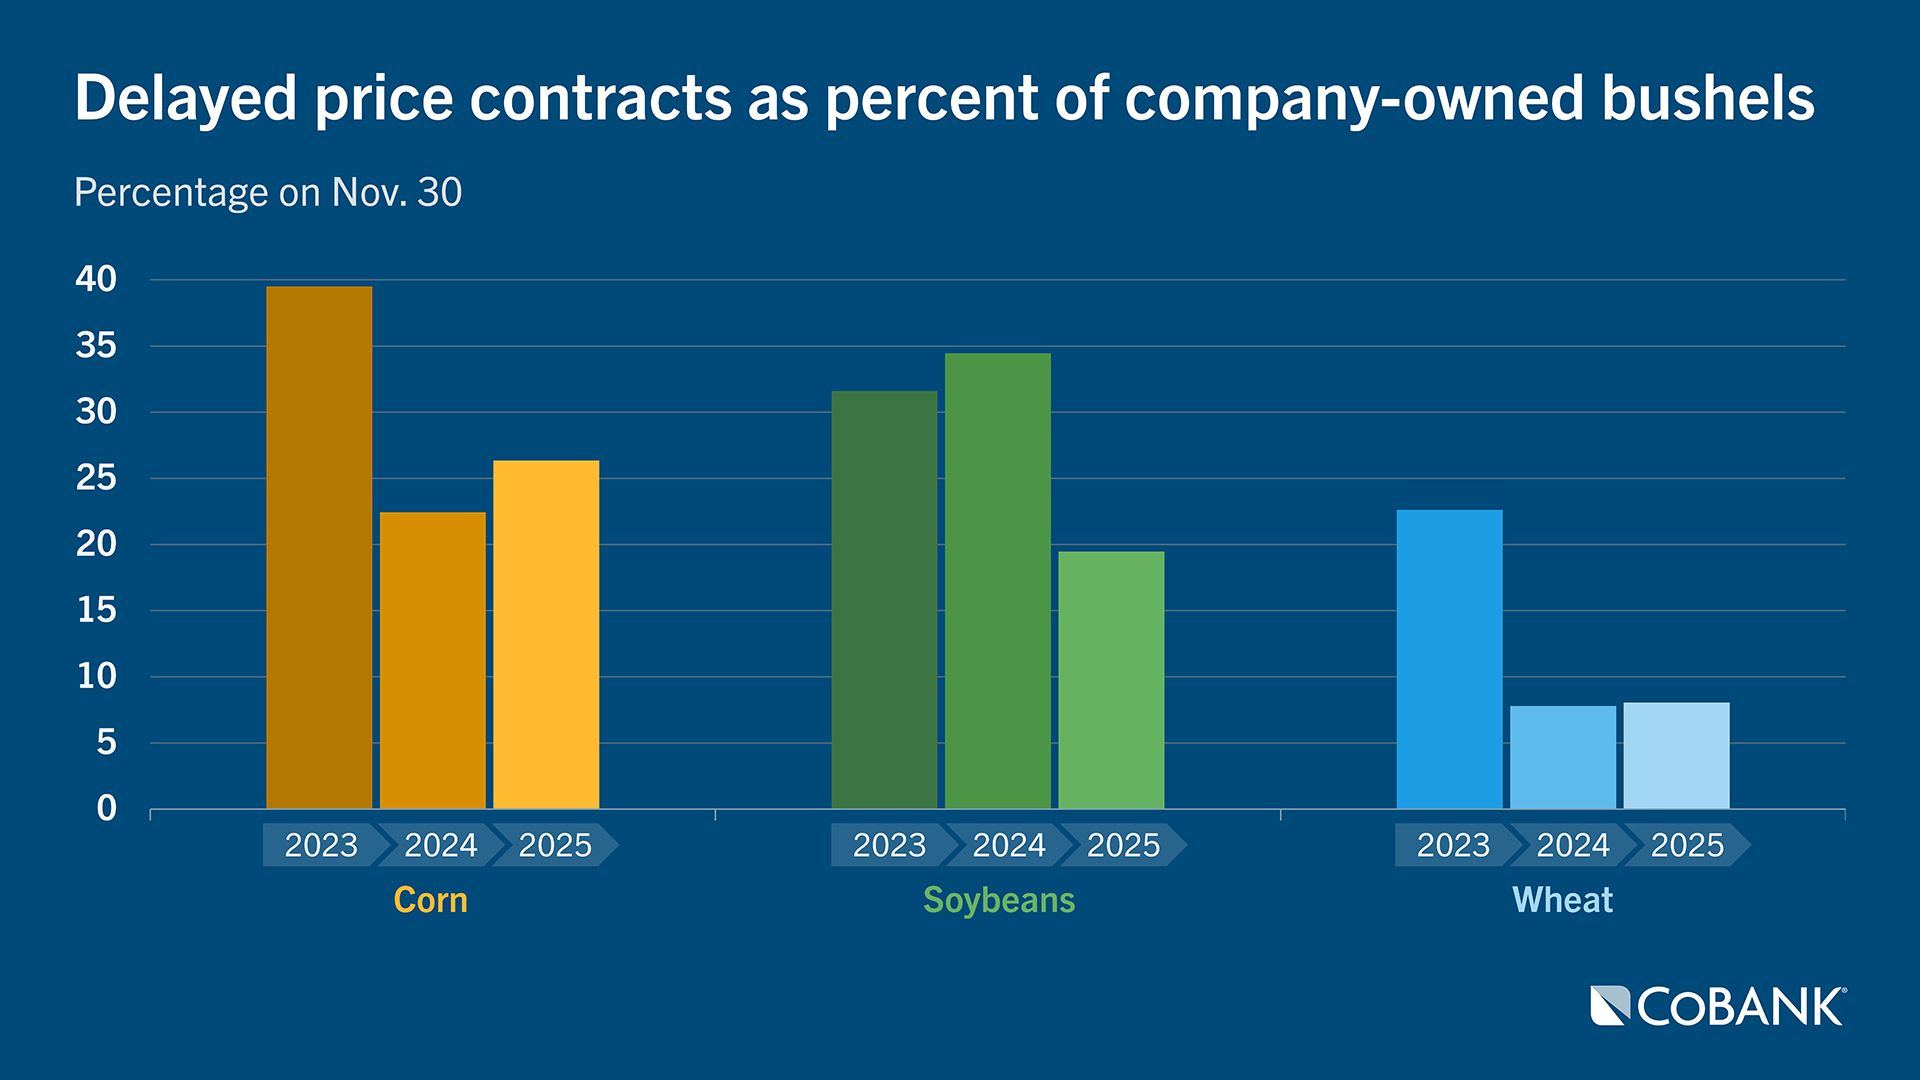
Farmers were less enthusiastic to price corn and wheat last fall. Company ownership of corn in commercial storage as of Nov. 30 fell to 73%, down from 77% the previous year while wheat fell to 72%, down from 75% last year. Utilization of DP and basis contracts increased for both corn and wheat as farmers left prices open in hopes of future recoveries in price. Lack of farmers selling of corn and wheat has supported cash basis in some regions, but the increase in the amount of bushels waiting to be priced implies greater selling pressure lies ahead for corn and wheat.
The total number of bushels stored off farm in commercial storage last fall was record large, according to USDA’s Grain Stocks report, with CoBank customers also reporting significant increases in total bushel handles. Relative to 2024, USDA’s data showed a larger share of soybeans and wheat were stored off farm, implying farmers made more room on the farm to store the record corn crop. Total U.S. corn stocks on Dec. 1 were record-high at 13.3 billion bushels, up 10% YoY. The share of the crop stored off farm on Dec. 1 fell to 34.5%, down from 37% the year prior. Off-farm corn stocks were tallied at 4.58 million bushels, up 3.9% YoY and the highest in seven years while on-farm storage increased 13.5% YoY to 8.699 billion bushels.
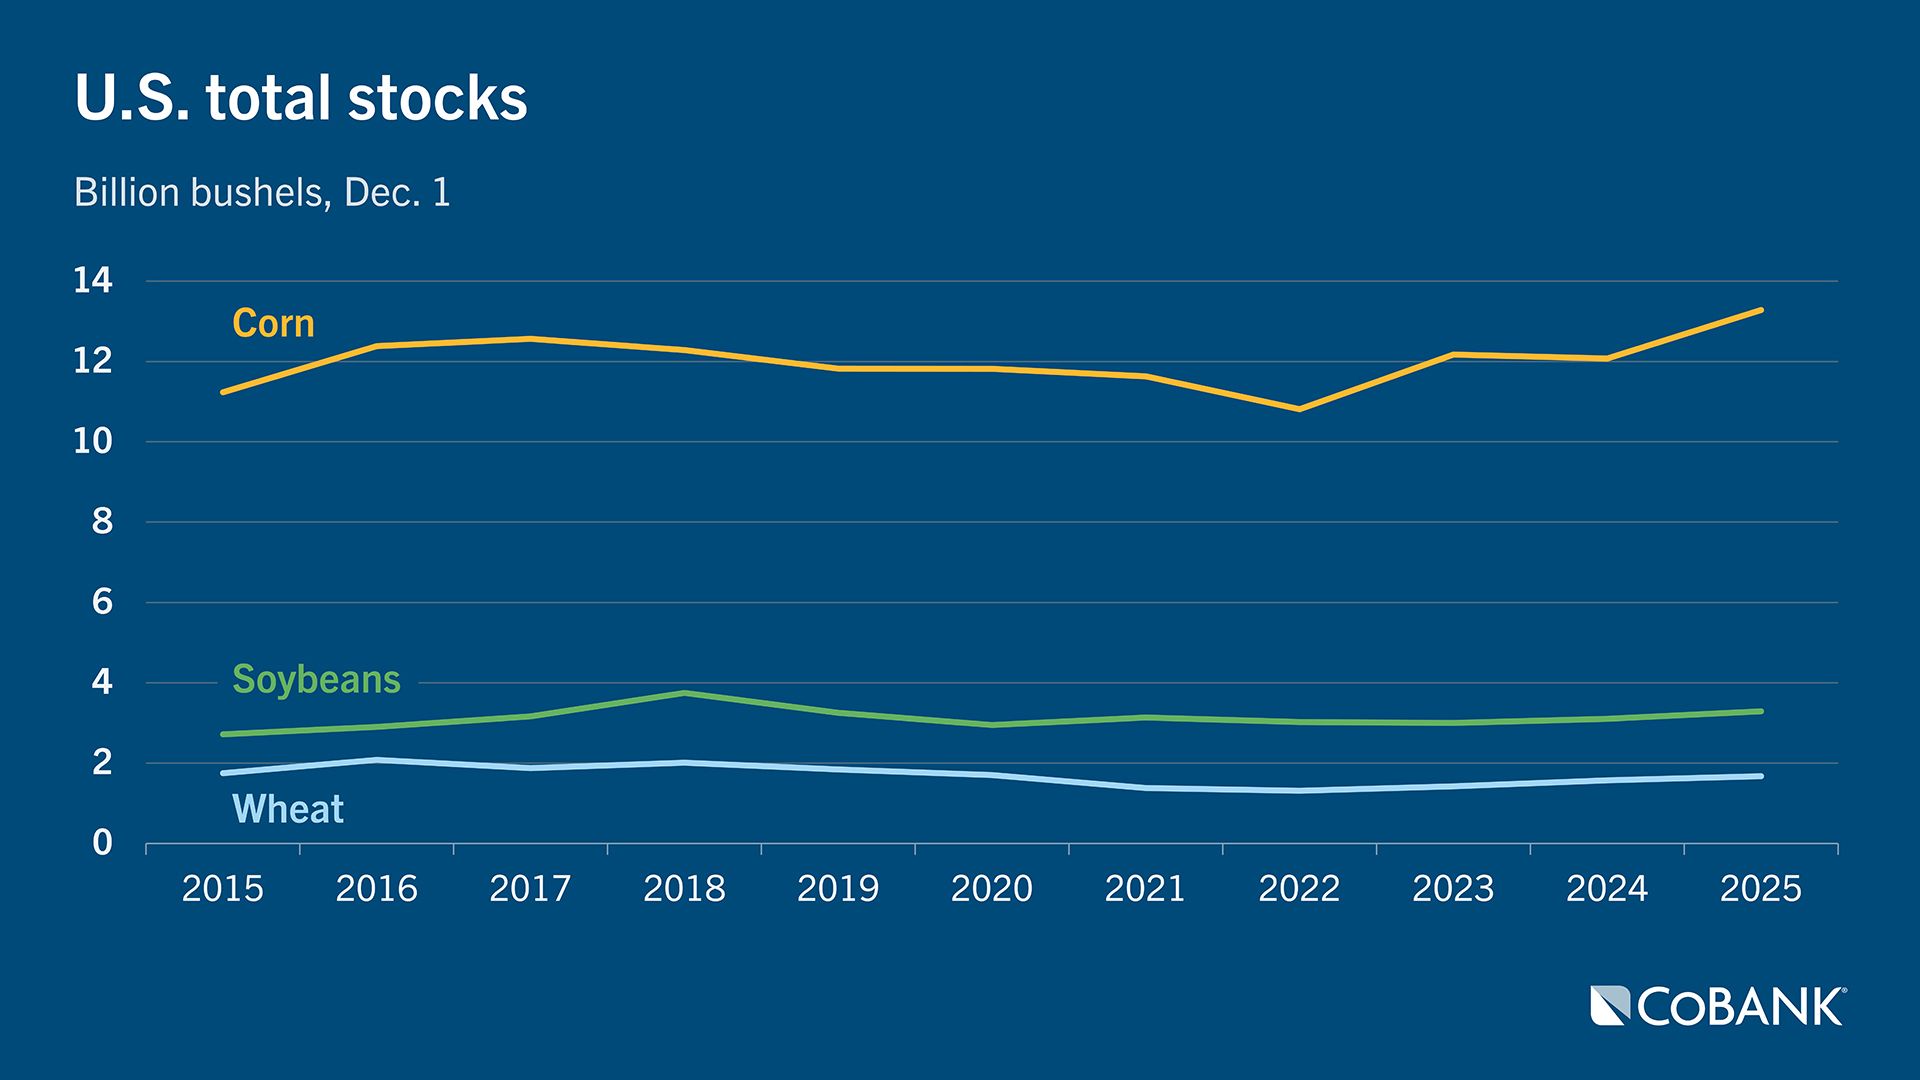
U.S. soybean stocks on Dec. 1 also rose to 3.29 billion bushels, up 6.1% YoY and the highest in seven years with off-farm stocks tallied at 1.71 billion bushels, up 9.9% YoY and the highest in six years. The share of the soybean crop in off-farm storage climbed to 52.1%, up from 50.3% last year and the highest in five years. Total U.S. wheat stocks on Dec. 1 were tallied at 1.675 billion bushels, up 6.5% YoY and the highest in six years with 73.4% of the crop stored off farm, up from 70.3% last year and the highest in four years.
CoBank’s data set includes grain companies from around the U.S. that provide monthly borrowing base position reports. The surveys do not include farmers’ marketing positions for commodities stored on-farm.
Outlook
CoBank’s data reveals that farmers have been patient sellers of corn and wheat. Any material increase in corn and wheat prices will likely be met with heavier selling pressure compared to soybeans that already experienced a higher level of farmer selling last fall. The increase in on-farm storage for corn in particular implies there is more corn in the countryside also waiting to be priced, pressuring both flat price and basis.
Disclaimer: The information provided in this report is not intended to be investment, tax, or legal advice and should not be relied upon by recipients for such purposes. The information contained in this report has been compiled from what CoBank regards as reliable sources. However, CoBank does not make any representation or warranty regarding the content, and disclaims any responsibility for the information, materials, third-party opinions, and data included in this report. In no event will CoBank be liable for any decision made or actions taken by any person or persons relying on the information contained in this report.